GPT Image 2 AI image example generated with this reusable CDance AI prompt: Generates an educational mathematical diagram explaining a degree 3 Hilbert curve, complete with a plotted graph, legend, and properties.
Hilbert Curve Infographic
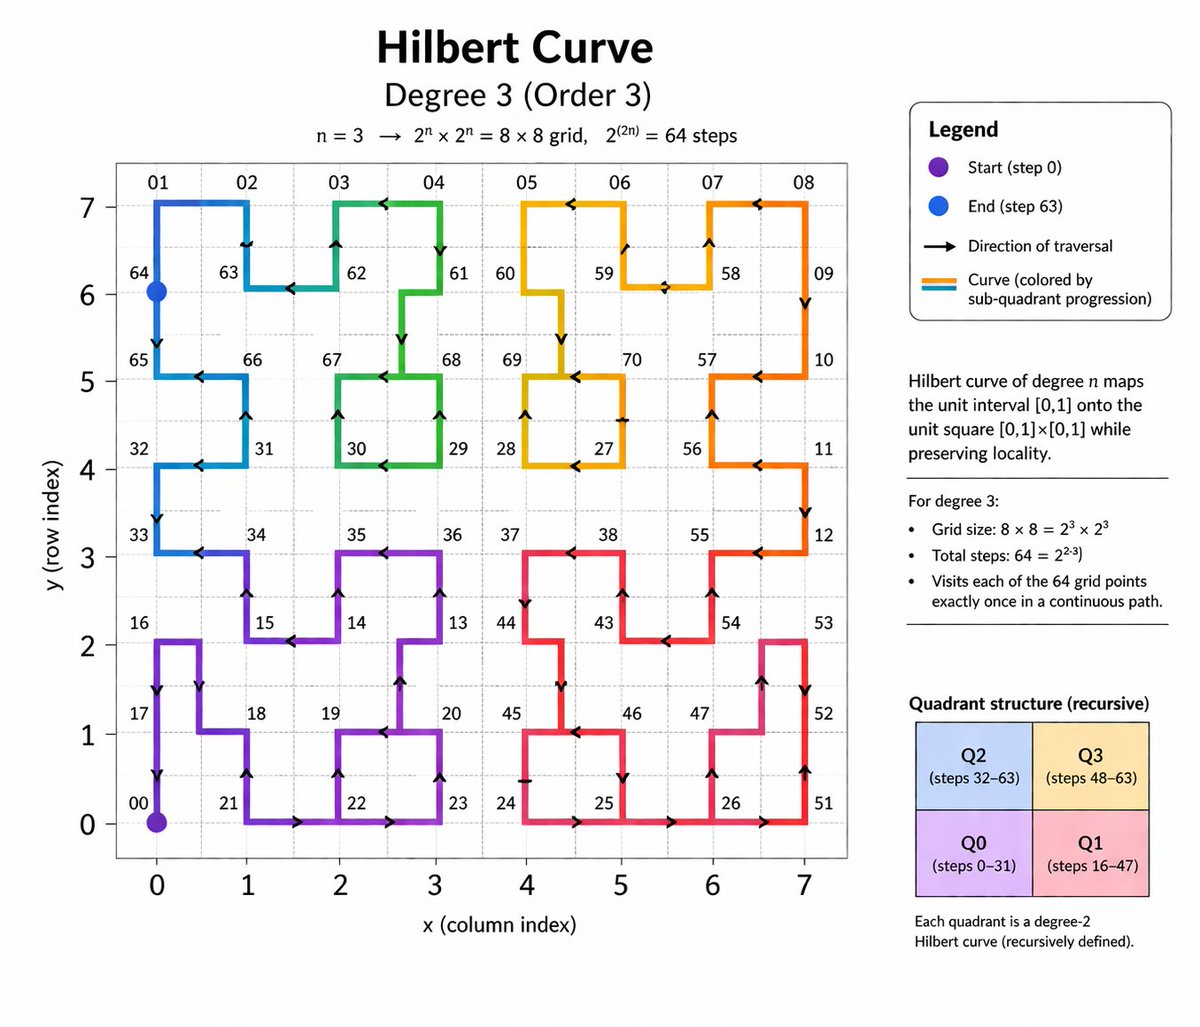
Generates an educational mathematical diagram explaining a degree 3 Hilbert curve, complete with a plotted graph, legend, and properties.
Prompt
{
  "type": "educational mathematical infographic",
  "header": {
    "title": "{argument name=\"main title\" default=\"Hilbert Curve\"}",
    "subtitle": "{argument name=\"degree subtitle\" default=\"Degree 3 (Order 3)\"}",
    "equation": "n = 3 -> 2^n x 2^n = 8 x 8 grid, 2^(2n) = 64 steps"
  },
  "layout": {
    "left_panel": "large 2D line plot",
    "right_sidebar": "stacked informational panels and text blocks"
  },
  "main_graph": {
    "axes": {
      "x_axis": "labeled 'x (column index)' with ticks 0 to 7",
      "y_axis": "labeled 'y (row index)' with ticks 0 to 7"
    },
    "grid": "{argument name=\"grid size\" default=\"8x8\"} dashed light gray lines",
    "curve": {
      "description": "continuous non-intersecting path filling the grid",
      "style": "thick line with directional arrows",
      "colors": "{argument name=\"curve colors\" default=\"gradient transitioning through purple, blue, green, yellow, orange, and red\"}",
      "markers": [
        "purple dot at bottom left labeled '00'",
        "blue dot at top left labeled '64'"
      ],
      "labels": "various two-digit numbers scattered along the path vertices, such as 01, 02, 32, 65, 70"
    }
  },
  "sidebar": {
    "sections": [
      {
        "title": "Legend",
        "type": "box with rounded corners",
        "count": 4,
        "items": [
          "purple dot: 'Start (step 0)'",
          "blue dot: 'End (step 63)'",
          "black arrow: 'Direction of traversal'",
          "colored lines: 'Curve (colored by sub-quadrant progression)'"
        ]
      },
      {
        "title": "Definition",
        "type": "text block",
        "text": "Hilbert curve of degree n maps the unit interval [0,1] onto the unit square [0,1]x[0,1] while preserving locality."
      },
      {
        "title": "Properties",
        "type": "bulleted list",
        "heading": "For degree 3:",
        "count": 3,
        "items": [
          "Grid size: 8 x 8 = 2^3 x 2^3",
          "Total steps: 64 = 2^{2*3}",
          "Visits each of the 64 grid points exactly once in a continuous path."
        ]
      },
      {
        "title": "Quadrant structure (recursive)",
        "type": "2x2 colored grid",
        "count": 4,
        "boxes": [
          "Top-left blue: 'Q2 (steps 32-63)'",
          "Top-right yellow: 'Q3 (steps 48-63)'",
          "Bottom-left purple: 'Q0 (steps 0-31)'",
          "Bottom-right pink: 'Q1 (steps 16-47)'"
        ],
        "footer_text": "Each quadrant is a degree-2 Hilbert curve (recursively defined)."
      }
    ]
  }
}
Related GPT Image 2 Prompts
VR Headset Exploded View Poster
Generates a high-tech exploded view diagram of a VR headset with detailed component callouts and promotional text.
Illustrated City Food Map
Generates a hand-drawn, watercolor-style tourist map featuring numbered local food specialties, landmarks, and a legend.
Momotaro Explainer Slide in Hybrid Style
A prompt that combines the simple, warm aesthetic of Irasutoya illustrations with the high-information density characteristic of Japanese government slides.
E-commerce Live Stream UI Mockup
Generates a realistic social media live stream interface overlaying a portrait, featuring customizable chat messages, gift popups, and a product purchase card.
Anime Martial Arts Battle Illustration
Generates a dynamic, high-impact anime illustration of two female characters fighting in a traditional dojo with elemental energy effects.
3D Stone Staircase Evolution Infographic
Transforms a flat evolutionary timeline into a realistic 3D stone staircase infographic with detailed organism renders and structured side panels.