GPT Image 2 AI image example generated with this reusable CDance AI prompt: Generates a journalistic data visualization comparing two contrasting trends over time with callout boxes and editorial headlines.
Editorial Dual-Axis Line Chart
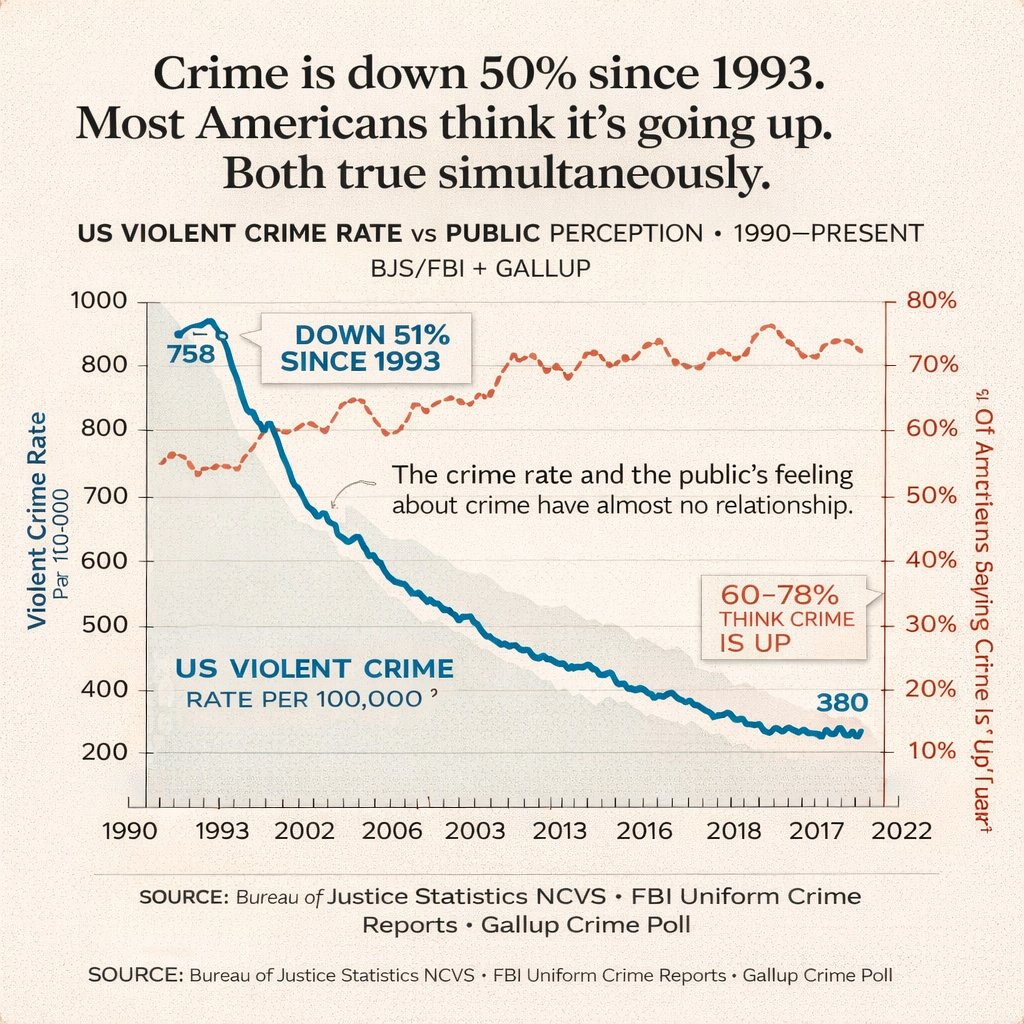
Generates a journalistic data visualization comparing two contrasting trends over time with callout boxes and editorial headlines.
Prompt
{
  "type": "dual-axis line chart infographic",
  "style": "editorial data visualization, matte paper texture background, clean journalistic design",
  "typography": {
    "headline": "serif font, bold, centered",
    "labels": "sans-serif, clean, uppercase and sentence case mix"
  },
  "layout": {
    "header": {
      "main_title": "{argument name=\"main headline\" default=\"Crime is down 50% since 1993. Most Americans think it's going up. Both true simultaneously.\"}",
      "subtitle": "US VIOLENT CRIME RATE vs PUBLIC PERCEPTION • 1990–PRESENT BJS/FBI + GALLUP"
    },
    "chart_area": {
      "background": "light beige with faint horizontal grid lines",
      "axes": {
        "x_axis": {
          "label": "Years",
          "ticks": ["1990", "1993", "2002", "2006", "2003", "2013", "2016", "2018", "2017", "2022"]
        },
        "y_axis_left": {
          "label": "{argument name=\"left axis label\" default=\"Violent Crime Rate Par 100-000\"}",
          "scale": ["200", "400", "500", "600", "700", "800", "800", "1000"],
          "color": "black"
        },
        "y_axis_right": {
          "label": "{argument name=\"right axis label\" default=\"% Of Americans Saying Crime Is 'Up'\"}",
          "scale": ["10%", "20%", "30%", "40%", "50%", "60%", "70%", "80%"],
          "color": "dark red"
        }
      },
      "data_series": [
        {
          "name": "Violent Crime Rate",
          "style": "thick solid blue line with light grey shading underneath",
          "trend": "starts high, drops sharply, then steadily declines",
          "data_labels": ["758", "380"]
        },
        {
          "name": "Public Perception",
          "style": "dashed dark red/orange line with small circle markers",
          "trend": "fluctuates but generally trends upwards, staying high"
        }
      ],
      "annotations": [
        {
          "text": "{argument name=\"blue line annotation\" default=\"DOWN 51% SINCE 1993\"}",
          "style": "callout box with pointer, blue text",
          "position": "top left, pointing to the blue line drop"
        },
        {
          "text": "60-78% THINK CRIME IS UP",
          "style": "callout box with pointer, red text",
          "position": "mid right, pointing to the dashed red line"
        },
        {
          "text": "{argument name=\"center insight text\" default=\"The crime rate and the public's feeling about crime have almost no relationship.\"}",
          "style": "floating text with a small squiggly arrow",
          "position": "center, between the two lines"
        }
      ]
    },
    "footer": {
      "source_text": "SOURCE: Bureau of Justice Statistics NCVS • FBI Uniform Crime Reports • Gallup Crime Poll",
      "repetition": "text is repeated twice at the bottom"
    }
  }
}
Related GPT Image 2 Prompts
VR Headset Exploded View Poster
Generates a high-tech exploded view diagram of a VR headset with detailed component callouts and promotional text.
Illustrated City Food Map
Generates a hand-drawn, watercolor-style tourist map featuring numbered local food specialties, landmarks, and a legend.
Momotaro Explainer Slide in Hybrid Style
A prompt that combines the simple, warm aesthetic of Irasutoya illustrations with the high-information density characteristic of Japanese government slides.
E-commerce Live Stream UI Mockup
Generates a realistic social media live stream interface overlaying a portrait, featuring customizable chat messages, gift popups, and a product purchase card.
Anime Martial Arts Battle Illustration
Generates a dynamic, high-impact anime illustration of two female characters fighting in a traditional dojo with elemental energy effects.
3D Stone Staircase Evolution Infographic
Transforms a flat evolutionary timeline into a realistic 3D stone staircase infographic with detailed organism renders and structured side panels.